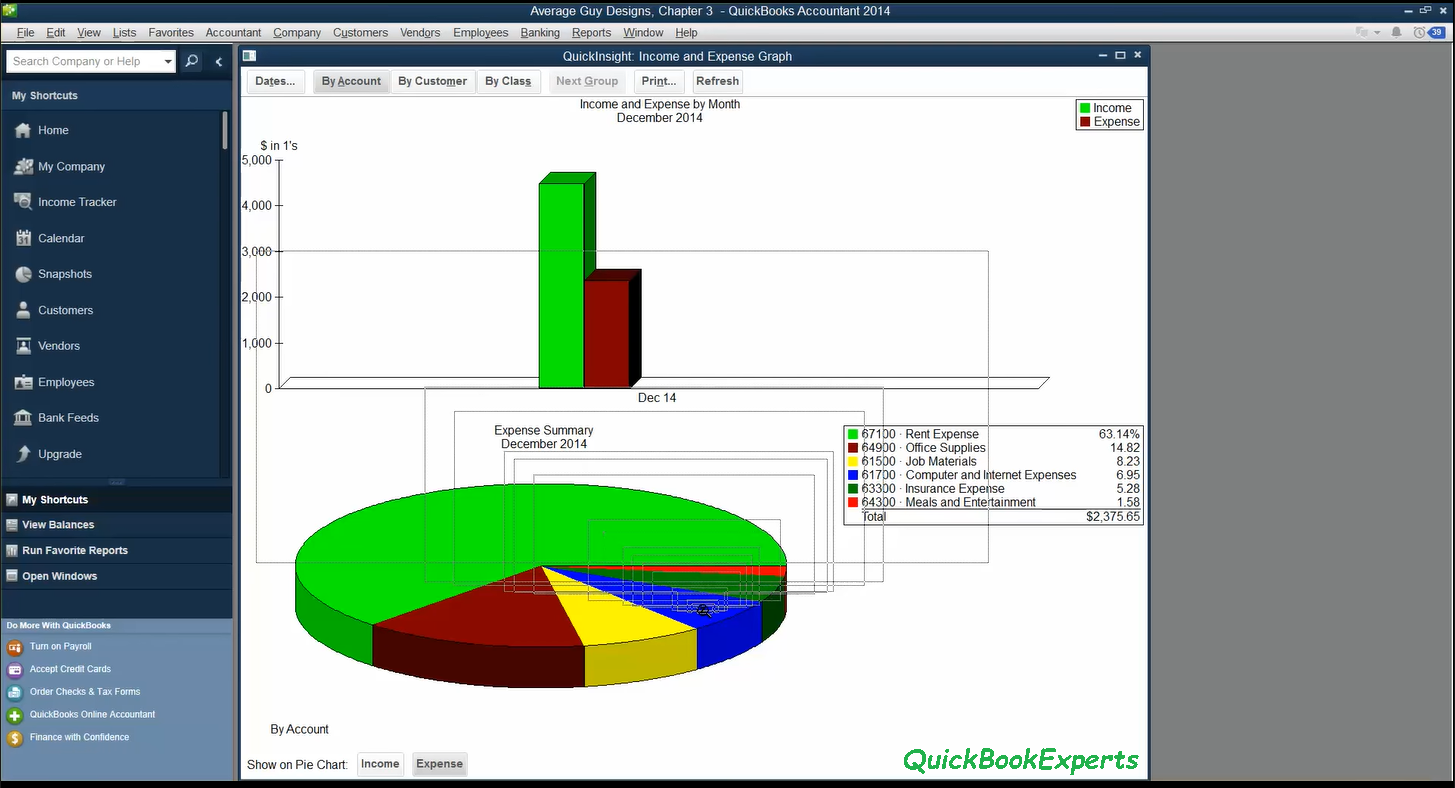
In this article we are going to talk about How to Create a Line Chart for Profit and Loss in QuickBooks?
The report displays the graphs of your income and expenses and how they’ve changed over time. Let me show you the steps:
- On the left panel, click Reports.
- Under Business Overview, click Business Snapshot.
- Choose the report date from the drop-down list under My Income and My Expenses graphs.
You can also see a graph for Profit and Loss when you go to your Dashboard.


